Performance Review
Every minute matters. Know your training zones.
Personally reviewed by Stephen Scullion. Understand your effort. Give every session a clear target.
Get my Performance Review£29.99 one-offReady in 3 working daysNo subscription
Reviewed zones
LT2
The 10k (31:17) and 15k (47:27) bests, the 6 × 5 min session and 3 × 3k all sit at 167–174 bpm and 3:08–3:16/km.
Illustrative zones for an example athlete.
Make your hard work count
Train at the right effort. Build the fitness for faster racing.
You put the miles in. Personally reviewed zones give that commitment a direction: when to hold back, where to work, and what each session is meant to build.
What getting fitter can look like
Illustrative3:30 start → 3:16 later · Pace at LT1 · 158–165 bpm
3:13 start → 3:01 later · Pace at LT2 · 166–174 bpm
Pace at the same effort across a block of training. Hypothetical; zone settings alone don't change fitness.
How reviewed zones guide your training
One runner. Three views of the same review.
Stephen sets each range where your own efforts settle: races, workouts, long runs. Tap a zone, then a point, to see the run behind it.
LT2 · The 10k (31:17) and 15k (47:27) bests, the 6 × 5 min session and 3 × 3k all sit at 167–174 bpm and 3:08–3:16/km. The top of the range is a boundary with some give, not a switch.
Performance Review
Build the fitness for faster racing.
Start with training zones that reflect your current fitness. Know the effort to aim for, build training you can recover from and repeat, and track whether your pace improves as your fitness develops.
Your Performance Review gives you personally reviewed zones and Stephen's explanation of how to use them in your training.
£29.99 one-offReady within 3 working days30 days Full Coaching & Fitness includedNo subscription
What getting fitter can look like.
Illustrative · not a predicted resultYour pace at the same effort, at the start of a training block and later in it. Starting paces are your current reviewed zones; faster is to the right.
Aerobic endurance
Pace at LT1 · 158–165 bpm
14 sec/km faster
Threshold endurance
Pace at LT2 · 166–174 bpm
12 sec/km faster
The aim is to move these paces forward through consistent training, giving you a stronger foundation for your next race.
Hypothetical example of adaptation over a block of training. Updating zone settings does not change fitness on its own; it sets the effort the training is built at.

Dublin Marathon 2023
Stephen Scullion, Olympian, reviews every assessment personally.
Tokyo 2020 Olympian2:09:49 marathonFounder, RunZones
Zones now
Reviewed zones as they appear in your account
166–174
LT2 · bpm
Illustrative example zones. Your own ranges are set by Stephen.
Make your hard work count
Every minute matters.
Know your training zones.
You make time. You put the miles in. Give that commitment a clear direction. Personally reviewed zones help you understand when to hold back, where to work, and what each session is meant to build—so you can train towards your next race with confidence.
- 01
Take the guesswork out.
Stephen reviews your running history to establish your personal zones, with pace and heart-rate guidance and a clear explanation of what each range means for you.
Reviewed zones · example runner
117142158166175LT2 in bpm and pace166–174 bpm · 3:08–3:18/km - 02
Give every session a target.
Head out knowing the effort you’re aiming for. Keep easy runs controlled, give threshold sessions a clear focus, and approach harder work with purpose.
Today · Threshold 6 × 5 min
166168172174Session target within LT2168–172 bpm · about 3:16/km - 03
See your hard work add up.
Track how your pace develops at comparable effort across repeated sessions. Build evidence of improving fitness—and confidence in the preparation behind your next race.
LT2 pace · same effort
IllustrationWeek 13:13Week 63:07Week 123:0112 sec/km faster at the same effort
Imagine your next start line—with a clearer understanding of your fitness and the work that got you there.
Get my Performance ReviewSession by session
What your zones change on each kind of run.
Threshold days
Hit the range the session is designed for.
Threshold work builds sustainable race pace, but only when it stays in range. Run it above range and it becomes a harder, less repeatable session that costs more to recover from.
LT2
166–174 bpm
3:08–3:18 /km
In the example review: LT2 reviewed at 166–174 bpm and 3:08–3:18/km, up from a watch setting of 160–168. The 6 × 5 min session below shows what that changes.
For the curious
How we establish your starting zones.
Your zones come from your own running, not a formula. We read your history for sustained efforts, races, workouts and long runs, plot each one by the pace you held and the pulse it cost, and Stephen sets each range where the evidence settles. Tap a zone to see the runs behind it and his reasoning.
Ranges are boundaries with some give, not switches. One heartbeat either side does not change what a run was.
Illustrative review · one example history
Reviewed zones and the running behind them
Pulse range
166–174
bpm
Pace guidance
3:08–3:18
/km
Supporting efforts
5
well supported
LT2 · The 10k (31:17) and 15k (47:27) bests, the 6 × 5 min session and 3 × 3k all sit at 167–174 bpm and 3:08–3:16/km. The top of the range is a boundary with some give, not a switch.
Your next session
Make your next session count.
Know the effort you’re aiming for, when to hold back, and when to push. Your reviewed zones give your training a personal starting point—so you can build purposeful weeks towards your next race.
Example runner · illustrative · Tue 7 Jul 2026
Threshold · 6 × 5 min
Intended: LT2 · reviewed target 166–174 bpm
Average heart rate per rep
Hover, tap or tab to a rep for pace
What this session shows
Five reps inside the reviewed range. The last one climbed above it.
Average pulse rose rep by rep as pace crept quicker, from 3:18 to 3:08 per km. Rep 5 sat on the top of the range and rep 6 finished above it. One high rep is not a failed session; it does show the effort built faster than intended.
Illustrative club-runner example, not a completed personal review. Ranges have some give: a rep at the edge is marginal, not wrong, and average pulse is one part of reading a session.
Clear targets for today. A stronger foundation for your next race.
Use your zones to guide consistent training, then track how your fitness develops across the weeks. See progress over time →
Progress over time
See how your running changes,
at the same effort.
Your Fitness page reads pace at comparable pulse alongside the training you have completed. This illustration samples the score every fortnight. Your reviewed zones are the ranges it reads, so the review and the tracking use the same yardstick.
Example runner · fitness score
Pace at comparable effort
19 Mar 2026 – 17 Sep 2026 · fortnightly score · higher is faster at the same pulse
68.4points · current
↓ 1.4 vs previous fortnight
What changed
4–17 Sep vs 21 Aug–3 Sep · observed pace within each reviewed range
How the review reads this
The score fell 1.4 points in the last fortnight and pace is slower in every band, most in the 150–157 and 166–174 ranges. Read against the reviewed zones, that is a slower fortnight after a 27 km long run and two race-pace efforts. That pattern alone does not establish its cause. The review does not promise the line turns up; it gives the ranges to hold in the next block, and this chart is where the result will show.
Shown as recorded. Gaps mean no supported reading in that fortnight.
What you receive
A personal assessment,
then the tools to act on it.
Two parts. The assessment is Stephen's one-off, written review of your running. The platform access is where your reviewed zones live and where progress is tracked afterwards.
Part 1 · Personal assessment
Your running, reviewed by Stephen
01
Assessment of your running evidence
Your history is read for sustained efforts, races, workouts and long runs. Poor GPS, missing pulse and non-running files are set aside.
02
Reviewed pace and heart-rate zones
Your ranges, each confirmed or adjusted by Stephen against the efforts that support it.
03
Why those ranges were selected
A written explanation, zone by zone: which runs the range rests on and how confident the evidence is.
04
Guidance on applying them
How to run each zone in practice: easy-day ceilings, threshold targets, when to work above them on purpose.
Part 2 · Platform access
Full Coaching now, plus 30 days after your report
- ✓Your confirmed zones appear in your account when Stephen releases the review
- ✓Every run read against them: time in zone, session job, drift
- ✓Fitness score and pace-at-effort tracking, tracked from your recorded running
- ✓Sessions with target ranges built from your zones
Continues only if you choose to subscribe afterwards. Your zones and history stay in your account either way.
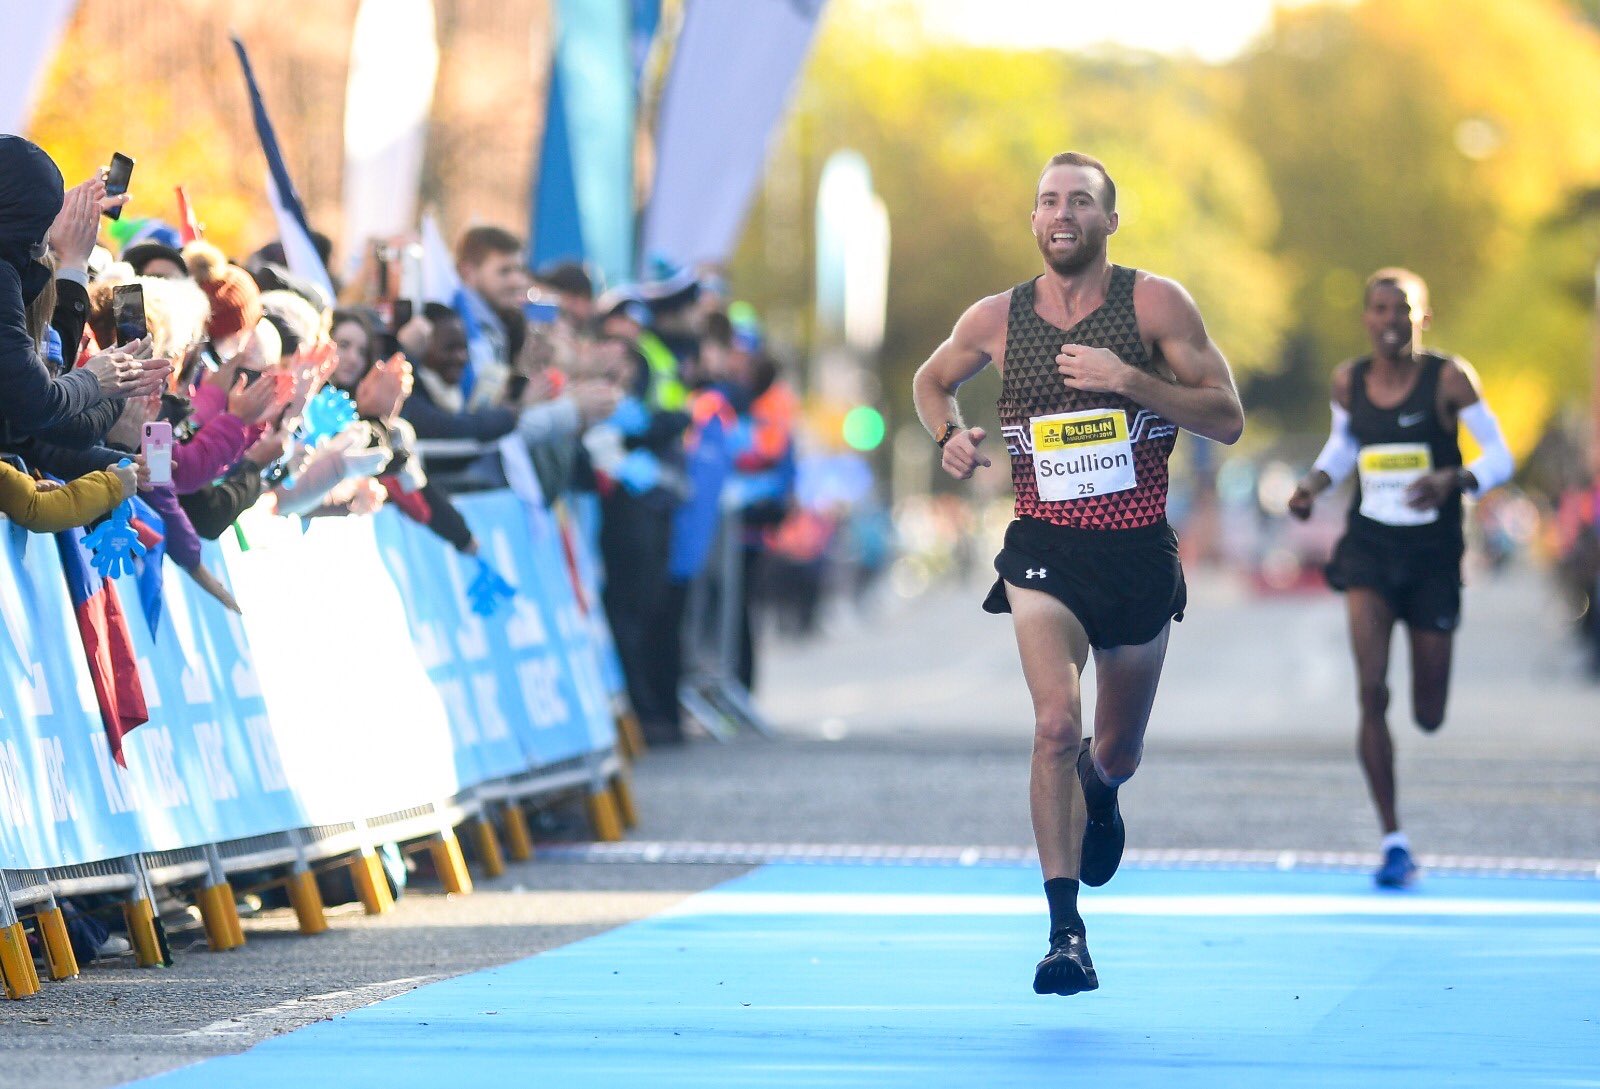
Smart work, not just hard work.
Big race-day performances rely on hard work. Make sure it is the right work.
Big race-day performances of course rely on hard work. But you need to be working at the right pulses, in the right zones, for the physiological changes to occur. Stephen reviews your evidence, sets those ranges for you and explains how to train in them. Smart work, not just hard work, and you can really surprise yourself.
Stephen Scullion · Tokyo 2020 Olympian · 2:09:49 marathon · founder of RunZones
A training build, tracked
Both thresholds pushed higher, week by week.
Consistent training can improve pace at the same effort. This hypothetical build shows faster pace at LT1 and LT2 across twelve weeks. Actual results depend on training, recovery and the available evidence.
LT1 pace
3:30 → 3:16
14 sec/km faster
LT2 pace
3:13 → 3:01
12 sec/km faster
Illustrative 12-week build starting from your reviewed zones. Not a predicted result; your rate of change depends on training and recovery.
Threshold pace at the same pulse
Faster is up · weekly readings
Performance Review
Personal assessment.
Clear training zones.
Practical direction.
£29.99one-off· no subscription
- ✓Reviewed pace + heart-rate zones for every intensity, set by Stephen
- ✓Written review: why each range sits where it does, and how to run it
- ✓Zones live in your RunZones account
- ✓30 days of Full Coaching & Fitness included
- ✓Delivered within 3 working days
What happens next
- 1
Pay once. You get a confirmation and a link to your account. Full Coaching opens immediately.
- 2
Bring in your history. Connect Garmin, Polar, Suunto or COROS, or upload your Strava archive ZIP as it is.
- 3
Analysis, then Stephen's review. Weak evidence set aside, the strongest efforts read, each range confirmed by hand.
- 4
Zones live, review in your inbox. Within 3 working days of your history being available. Your included 30-day period starts when your report is sent.
“Definitely would pay more considering lab tests are £200 if not more. It looks spot on for how I judge my runs.”
“I know exactly what type of run I'm doing and why I'm doing it, rather than just chasing a pace.”
“It's great to have an idea now how the lab results should sit with RunZones zones and paces. This helps a lot to execute the sessions correctly.”
Before you buy
Know your zones. Train with control.
Your running history, read by an Olympian, returned as ranges you can use on the next run.
Reviewed zones · pace + HR · within 3 working days · 30 days platform access · no subscription